A Primavera-style Gantt with a hierarchical, collapsible WBS grid alongside a synchronized timeline. It reads your Primavera P6 XER directly and renders activities, relationships, baselines, and the critical path the way schedulers expect.
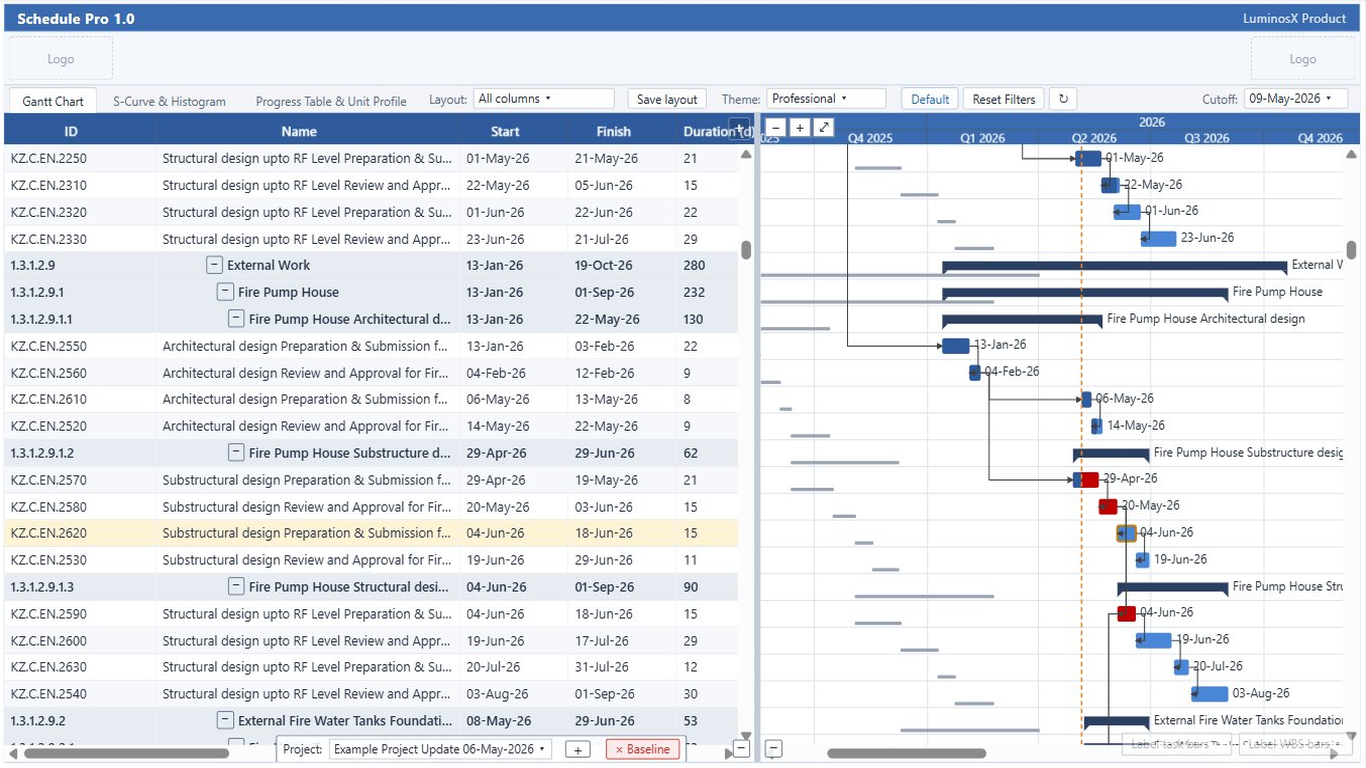
The WBS grid and the time-scaled bar area scroll together. The timeline groups into day, week, and month tiers so a multi-year programme stays readable.
When the report loads, the timeline scales so the whole schedule is visible without manual zooming, then you can zoom in for detail.
Activities draw as task bars; WBS rows roll up to summary bars that span their children. Bar shapes are configurable for each.
A vertical marker shows the project data date (progress line), so planned-vs-actual is obvious at a glance.
Finish-to-Start, Start-to-Start, Finish-to-Finish, and Start-to-Finish relationships draw between bars with routing that follows the logic.
Resize, reorder, and show or hide grid columns to build the view your team reads from.
Bars shade by percent complete so in-progress and finished work is distinguishable at a glance.
Expand and collapse the work-breakdown hierarchy, and color rows by WBS level to make the structure pop.
Pair a baseline XER with the current schedule to draw baseline bars under the current ones and see slippage directly.
Critical activities are emphasized so the driving path stands out from float-bearing work.
Zero-duration milestones render as diamonds, and date markers can call out key events on the timeline.
Choose what each bar shows — activity name, dates, percent complete — without crowding the timeline.
Primavera, Microsoft Project, light, and dark themes, plus custom header logos and colors to match your organization.
Capture a full layout — column widths, order, hidden columns, and WBS coloring — and restore it later or share it across reports.